RSI: The Relative Strength Index Explained
- Lode Van de Velde
- Nov 25, 2024
- 3 min read

If you've been dipping your toes into trading, you've probably come across RSI—short for Relative Strength Index. This little indicator is like a thermometer for market emotions, showing if an asset is getting “too hot” or “too cold” by revealing whether it’s overbought or oversold.
What Exactly Is RSI?
RSI is a measure of recent price movements, calculated to spot when an asset’s price might have gone up or down a bit too fast. It does this by comparing the average gains and losses over a recent period (usually 14 days), and then it crunches the numbers into a single value on a scale from 0 to 100.
So, How Does It Work?
When RSI gets to above 70, that’s often considered “overbought.” This doesn’t mean the price will go down, but it’s a warning sign. It suggests the asset has seen a lot of buying interest lately, pushing the price higher—maybe a bit too high. When lots of people buy, demand raises, and prices shoot up, sometimes faster than is sustainable.
On the flip side, if RSI is below 30, it’s seen as “oversold.” In this case, the asset’s price has been dropping a lot recently, meaning people might have sold too aggressively. This can often signal a price that’s getting “too cold,” and it might be due for a bounce back up.
Why It Matters
RSI is popular because it gives traders a quick snapshot of momentum—how strongly the price is moving in a direction. Traders look at RSI to spot potential buy or sell points: a high RSI might mean it’s time to consider selling, while a low RSI could be a buying opportunity. Of course, it’s not a crystal ball, but it helps traders spot moments when prices might be about to change direction.
In short, RSI is a handy tool that turns price data into clues about market mood—helping traders decide when to jump in or take a step back.
Spotting Divergence with RSI: A Hidden Signal
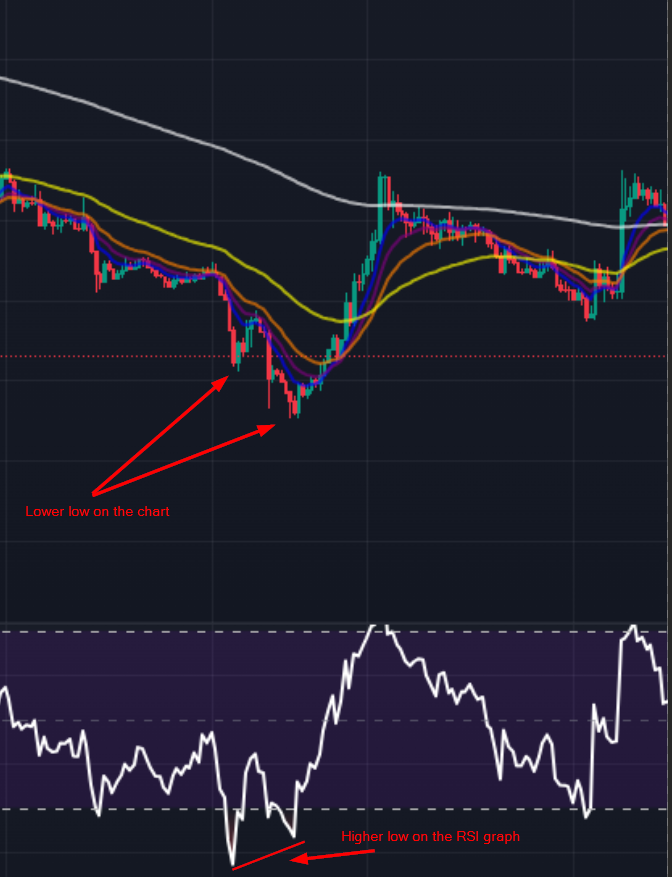
One of the powerful yet subtle signals that RSI can provide is divergence. Divergence happens when the direction of RSI doesn't match the direction of the asset’s price. This mismatch can be a hint that the current trend is losing strength and could reverse soon. Here’s how it works:
Types of RSI Divergence
Bullish Divergence:
This happens when the asset’s price is making lower lows (the price keeps dropping), but the RSI is making higher lows (the RSI line starts trending up).
Bullish divergence suggests that, even though the price is falling, the selling pressure is weakening, and buyers might be ready to step in. It’s often a signal that a price reversal to the upside could be coming.

Bearish Divergence:
Bearish divergence occurs when the asset’s price is making higher highs (the price keeps rising), but the RSI is making lower highs (the RSI line starts trending down).
This signals that, despite rising prices, buying momentum is weakening. Bearish divergence can indicate that a price drop or trend reversal to the downside might be near.

Why Divergence Matters
Divergence is valuable because it can reveal hidden shifts in market momentum that aren’t immediately obvious from the price alone. While RSI divergence doesn’t guarantee a reversal, it’s often seen as a warning signal, allowing traders to prepare for potential changes.
For the Number Nerds: How RSI Is Calculated
If you’re ready to dive into the math behind RSI, here’s how it works. The RSI calculation is based on the average of recent price gains and losses, typically over a 14-day period. It’s a step-by-step process:
Step 1: Determine the Relative Strength (RS)
To find the Relative Strength (RS), divide the average gain by the average loss over the period:

Step 2: Calculate the RSI
Once you have the RS, you can calculate the Relative Strength Index (RSI) using the formula:

Example Calculation
Let’s say over the past 14 days, the average gain was 1.5 and the average loss was 0.5.
Step 1: Calculate RS

Step 2: Plug RS into the RSI Formula

In this example, the RSI would be 75, indicating that the asset is leaning towards “overbought” territory, since it’s above the 70 threshold.
By using this formula, traders can turn raw price data into actionable insights on momentum, helping them identify when an asset may be ready for a trend reversal.
Comments